




Why Pakistan
Home >> Why Pakistan >> Economy
Why Pakistan
Economy
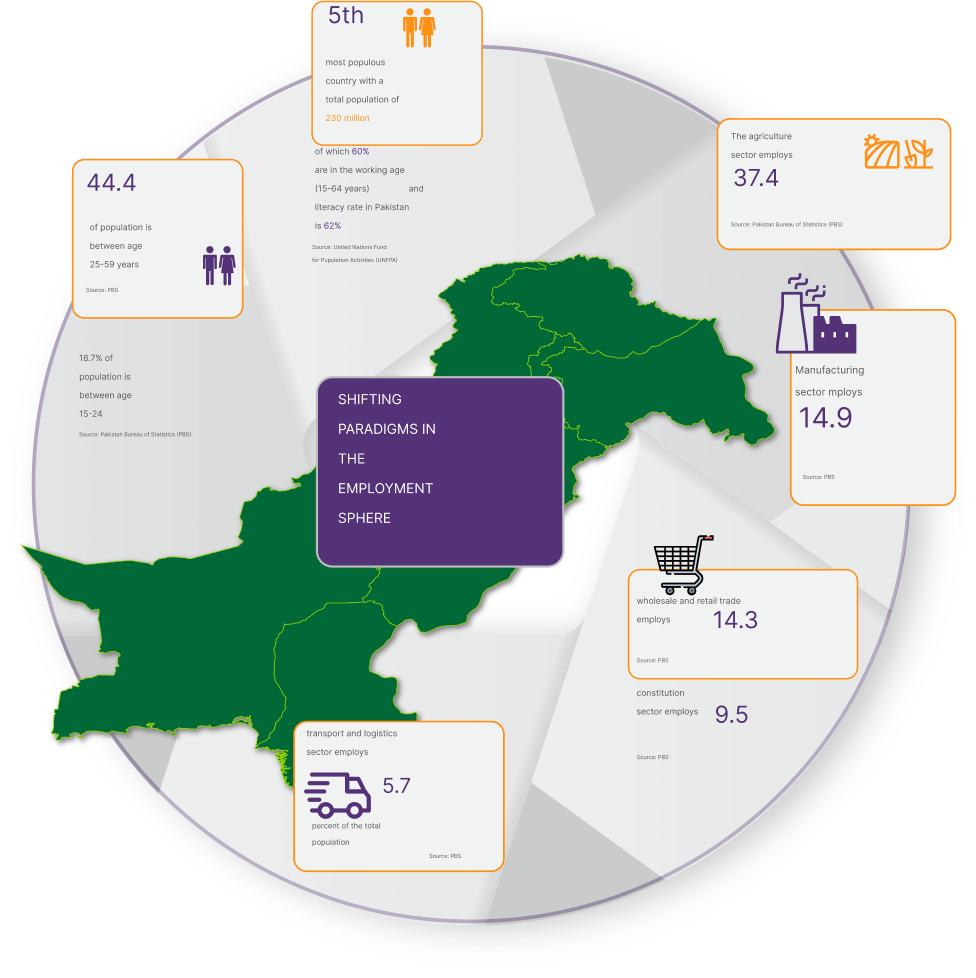
Pakistan offers a unique blend of skills coupled with a trained young labor force. Pakistan is home to the world’s 10th largest workforce and lies among the world's youngest working population with an overall literacy rate of 62 percent and only 6.3 percent unemployment rate. 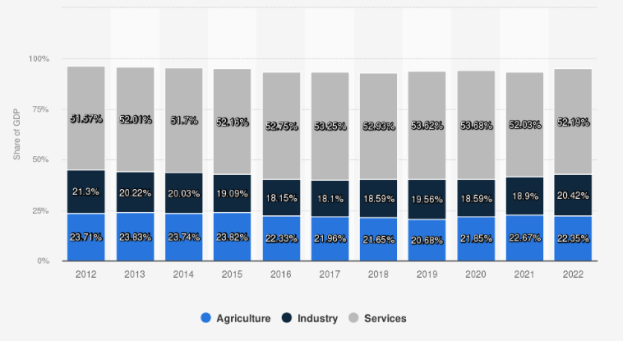
With a total of 279 thousand educational institutions and 247 universities/HEIs in the country, Pakistan is a leading market for tech and innovation. According to the global talent competitiveness index (2022), Pakistan is ranked 86 for Growth indicators including formal education and lifelong learning opportunities.
Pakistan’s economy is divided into three sectors; the primary sector, which includes agriculture, raw materials, fishing, and hunting, the secondary sector, which is called the industrial sector and includes manufacturing, and the tertiary sector, which encompasses intangible goods and services, like financial services, tourism, or telecommunications.
| Country | 2011-12 | 2012-13 | 2013-14 | 2014-15 | 2015-16 | 2016-17 | 2017-18 | 2018-19 | 2019-20 | 2020-21 | 2021-22 | 2022-23 | 2023-24 | 2024-25 (Jul-Aug) |
|---|---|---|---|---|---|---|---|---|---|---|---|---|---|---|
| China | 126.1 | 90.6 | 695.8 | 340.8 | 1,048.3 | 763.2 | 1,311.9 | 130.8 | 846.6 | 751.6 | 531.6 | 432.2 | 568.2 | 174.7 |
| UK | 205.8 | 633.0 | 157.0 | 169.6 | 151.7 | 215.4 | 304.6 | 185.0 | 119.1 | 141.0 | 31.8 | 65.0 | 268.2 | 43.5 |
| USA | 227.7 | 227.1 | 212.1 | 223.9 | 15.7 | 45.7 | 161.7 | 88.1 | 99.2 | 166.4 | 249.6 | 89.3 | 137.3 | 22.7 |
| Hong Kong | 80.3 | 242.6 | 228.5 | 136.2 | 187.0 | 123.0 | 183.6 | 171.0 | 190.7 | 157.2 | 137.7 | 101.0 | 358.5 | 70.2 |
| Switzerland | 129.9 | 149.0 | 209.8 | (6.5) | 59.5 | 101.7 | 78.5 | 21.2 | 62.8 | 61.7 | 146.2 | 134.0 | 28.7 | 0.5 |
| U.A.E. | 36.8 | 22.5 | (47.1) | 235.3 | 114.6 | 120.1 | (4.4) | 103.7 | (44.0) | 115.7 | 143.9 | 180.1 | 87.3 | 9.4 |
| Italy | 200.1 | 199.4 | 97.6 | 115.4 | 105.4 | 61.5 | 56.6 | 51.9 | 57.4 | 36.3 | 34.8 | 8.6 | 1.9 | (0.3) |
| Netherlands | 22.3 | (118.7) | 5.5 | (34.5) | 29.9 | 457.6 | 100.3 | 69.0 | 133.2 | 96.9 | 104.1 | 71.9 | 71.0 | (3.0) |
| Austria | 69.1 | 53.3 | 53.8 | 24.8 | 42.7 | 21.7 | 27.4 | 7.6 | 3.8 | 1.0 | 0.0 | (0.3) | (1.7) | (0.5) |
| Japan | 29.8 | 30.1 | 30.1 | 71.1 | 35.4 | 57.7 | 59.8 | 117.3 | 52.5 | (13.0) | (12.3) | 183.0 | 10.9 | 2.5 |
| Turkey | 3.3 | 0.5 | 7.9 | 43.4 | 16.9 | 135.6 | 29.8 | 73.8 | 26.1 | 13.4 | (0.3) | 17.6 | 11.1 | 1.2 |
| Others | (310.5) | (73.0) | 47.7 | (285.7) | 585.8 | 303.4 | 470.5 | 343.0 | 1,076.2 | 305.7 | 500.7 | 173.4 | 360.2 | 29.3 |
| Total | 820.7 | 1,456.5 | 1,698.6 | 1,033.8 | 2,392.9 | 2,406.6 | 2,780.3 | 1,362.4 | 2,597.5 | 1,820.5 | 1,867.8 | 1,455.8 | 1,901.6 | 320.3 |
A tale of pakistan
Pakistan has some of the greatest demographic opportunities for development in the world as a growing youth population enters adulthood.
COUNTRY WISE NET FOREIGN DIRECT Investment
USD MILLION (2022-2023)

HONG KONG
497.9

CHINA
439.3

UNITED KINGDOM
219.1

OTHERS
181.9

USA
116.0

UAE
79.7

NETHERLANDS
64.9

SWITZERLAND
29.7

TURKEY
12.8

ITALY
7.3

JAPAN
5.0

AUSTRIA
1.5
SECTOR WISE NET FOREIGN DIRECT Investment
USD MILLION (2022-2023)
POWER
637.5
OTHER
265.0

OIL & Gas
192.5

FINANCIAL BUSINESS
169.6

COMMUNICATION
126.5
TRADE
59.5
CONSTRUCTION
16.9

CHEMICALS
14.1

TRANSPORT
6.6
ELECTRICAL MACHINERY
3.3